Partner, Head of Fixed Income
Update: March 20, 2025
The Fed’s March meeting resulted in a decision to leave rates unchanged, which was in line with market expectations. Markets were also anticipating the new Summary of Economic Projections (SEP), which includes the popular dot plot.
While the headlines are focused on the dot plot, there is other information in the SEP that is more relevant. Three key changes in the latest SEP jumped out to us.
1. Slower Growth: There was a change in the median real GDP projections for 2025 by -0.4%, -0.2% for 2026 and -0.1% for 2027.
2. Slightly Weaker Jobs: The Fed increased its unemployment rate projections for 2025 to 4.4% from 4.3%.
3. Higher Inflation: The projections for inflation over the next three years were all revised higher, with the most notable being a 0.3% increase in both PCE and Core PCE for 2025.
These key shifts are not reflected in the dots. At best, this highlights how the dot plot implies a confusing message.
“The dot plot doesn’t have a good track record, its dispersion among FOMC members is not reflective of actual votes and it can contradict the message the FOMC is trying to send.” (Read my Forbes.com story linked here to learn about the dot plot and why it no longer serves its primary purpose: providing transparency.)
For a better understanding of the Fed’s potential next move, we recommend that investors ditch the dots and focus on more relevant SEP data, including the projected appropriate monetary policy table below (click here to view the Fed's full SEP).
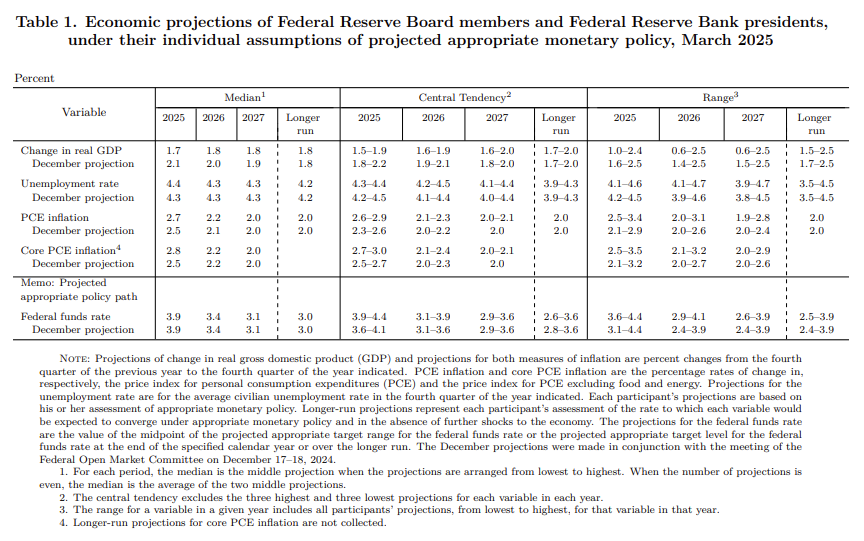
The three changes mentioned above from this table suggest that, at the margin, the probability of stagflation has increased. While not our base case, the odds are increasing, which will make the Fed’s job more difficult and investment decisions more challenging. I outline key takeaways for investors in my latest Forbes.com column – click here to read.
Update: March 14, 2025
How are consumers feeling about inflation? Not so good!
Starting in 1978, the University of Michigan has conducted its survey of U.S. consumers monthly. As part of the survey, there is a question asking if participants think prices in general will go up, or go down, or stay where they are now, and by what percent over the next 12 months. They ask the same question with a 5- to 10-year outlook as well.
The results of the most recent survey, which was released today, show a significant increase in consumers’ expectations for inflation over both the near and long term.
The median response for the 12-month outlook question was 4.9%, the highest since November 2022. For the longer-term outlook, the median response came in at 3.9%, the highest in three decades! Consumers are clearly concerned about inflation, and if this continues, it could impact both near-term and future demand, resulting in a negative impact on the U.S economy.
While this most recent data is not very optimistic, this forward-looking consumer data is only one piece of the inflationary picture. It is but one of the data points that impacts markets and that officials use to determine monetary and fiscal policies. For a deeper analysis, I wrote about how this may impact monetary policy in my Forbes.com piece, linked here.
We will have to wait and see if this heightened expectation is sustainable. If it is confirmed by other data, this makes the Fed’s job a bit more difficult and will add to market volatility. As we mentioned in our outlook for 2025, expect volatility in financial markets—and we no doubt have seen that occur.
Update: March 7, 2025
Today's February jobs numbers came in weaker than expected, which, in our opinion, increases the probability of future stagflation. Of note from the report, the unemployment rate increased to 4.1% alongside downward revisions of the payroll data from January.
While still not our base case and a bit early to confirm, next week’s February CPI data, although backward-looking, will help in confirming if the data trend towards stagflation will continue.
Published: March 5, 2025
What do we call an economic environment characterized by high inflation, declining growth and increasing unemployment? Stagflation. Looking at recent market signals, it appears two of those three are now priced in.
The market-implied inflation outlook for the next two years has been rising, significantly beyond the Fed’s 2% target. The market is also pricing in three 0.25% fed funds rate cuts for 2025—a substantial change from roughly one cut just a month ago. See the chart below.
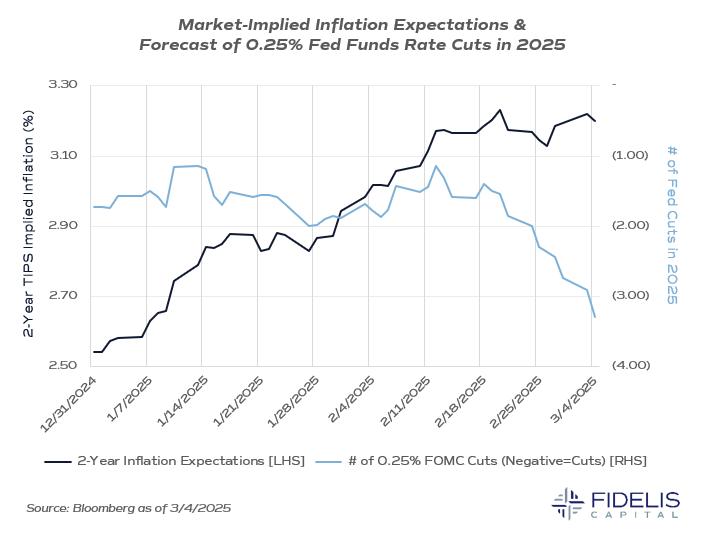
The third element of stagflation, rising unemployment, has yet to appear. Unemployment is a lagging indicator, and the Bureau of Labor Statistics will release its February jobs data this Friday, March 7.
Economists surveyed by Bloomberg are expecting no increase in the unemployment rate from 4%. We suspect that if the unemployment rate doesn’t tick up on Friday, it may in the coming months. To be clear, it’s too early for us to predict such an environment, but the markets are showing a trend in that direction.
Investing during a stagflationary environment is difficult, and it’s important that investors work with their advisors to navigate market volatility. There is no standard recipe for success, as past inflationary environments have shown. For a deeper look at those occurrences, read my latest Forbes.com article, “What Investors Should Know About Investing During Rising Inflation.”