Thursday, it was announced that any goods compliant with the United States-Mexico-Canada Agreement (USMCA) would be exempt from the blanket tariffs. For context, 50% of imports from Mexico and 38% of imports from Canada were USMCA compliant in 2024. It isn’t clear yet how non-compliant goods will be treated.
While conversations with Canada appear to be more rocky, Mexico’s President Claudia Sheinbaum said of the latest tariff conversation with President Trump, “Essentially, it puts Mexico in the framework for reciprocal tariffs.”
Negotiations are ongoing, and by the time you receive this note, much could have changed. We know that President Trump is just getting started with tariff policies, so we expect headline volatility to remain for the foreseeable future.
Outside of tariff policy, several market developments this week are worth watching.
February Labor Market Update
This morning, the Bureau of Labor Statistics released its monthly employment report, stating that 151,000 jobs were added in February. Additions were in the healthcare, financial services, transportation, warehousing and social assistance sectors, while the federal government was the only sector to decline for the month.The report was relatively in line with market expectations, though the unemployment rate ticked up to 4.1% from 4%. The average hourly earnings annual growth, however, came in at 4% against an expectation of 4.1%. Average hourly earnings is a solid proxy for wage inflation, so declines in this statistic are welcome. We will be paying close attention to the February inflation report, which will be released this upcoming Wednesday.
Measuring Policy Uncertainty
Charted below is the Economic Policy Uncertainty Index for the last 10 years, plotted monthly. The index is calculated by scanning news coverage for mentions of uncertainty, factoring in the list of upcoming tax code expirations and analyzing dispersion among popular economic forecasters.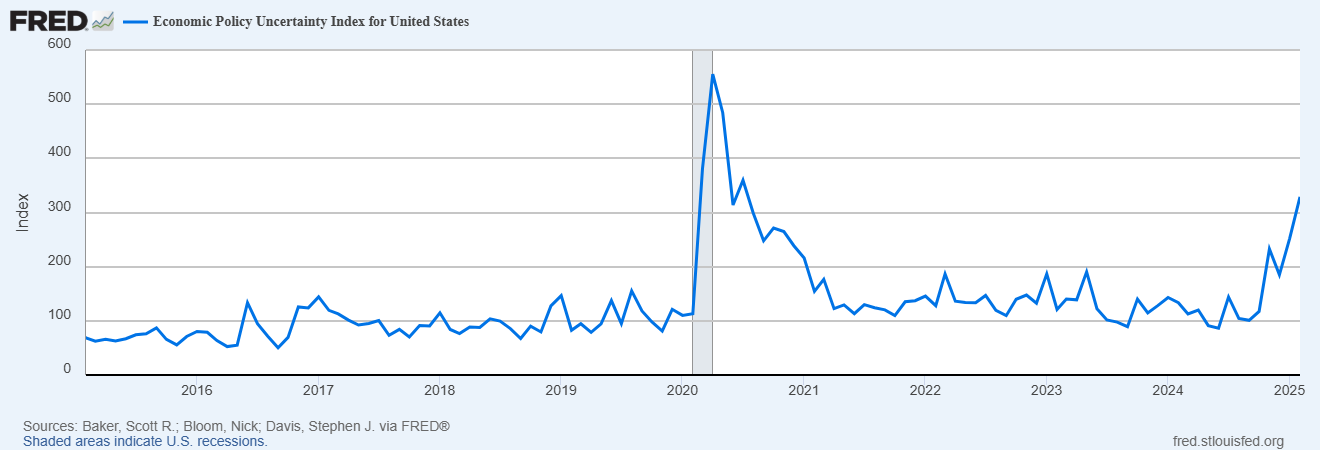
It is clear from the chart that uncertainty levels have been on the rise since the election and are nearing levels not seen since the early days of the pandemic. This is a reflection of the anxiety about policy direction under the Trump administration. There’s no doubt this is a major contributor to current volatility, underscoring the need for more certainty about the future path of economic policy.
GDP: Feeling the Pain
The Atlanta Federal Reserve’s GDPNow tracker moved to a projection of -2.4% for Q1 2025. If the U.S. records negative GDP growth in Q1, it would break a positive growth streak dating back to Q2 2022.With a strong underlying economy, why is GDP on track to disappoint? Before reviewing this, it’s important to understand the formula to calculate GDP: C + I + G + NX (as used by the Bureau of Economic Analysis).
- C = Consumer Spending (the largest driver of overall GDP)
- I = Business Investment (a proxy for the money that businesses are spending on fixed assets)
- G = Government Spending
- NX = Net Export
Bearing in mind the current negative forecast, it is clear that two components (Government Spending and Net Exports) will be a drag on GDP in the first quarter.
DOGE and Elon Musk have been on a mission to cut spending across different departments within the federal government, and this will be felt with a lower “G” variable.
Due to the anticipation of post-inauguration trade disruption, businesses went on an import spree in the first quarter to bolster inventories before potential tariffs went into effect. Net Exports equals Exports minus Imports, so a boosted import number will cause “NX” to fall.
If Consumer Spending is in good shape for the first quarter but GDP overall is negative, the economic impact may be less significant than the headline number would suggest.
We’ll be watching closely, and this is a good example of how trade-related uncertainty is having an impact on behavior that will be felt in some capacity by the overall economic data.