The Market Correction in Charts
The S&P 500 hit an all-time high on February 19. Since then, there has been a downtrend due to the ongoing policy volatility we’ve been discussing. While markets are correcting, it’s important to look underneath the hood for developing trends or changes in leadership.Something we’ve spoken about the past few years is the idea of market concentration. As a refresher, the S&P 500 is a market-weighted index, which means that bigger companies have a bigger share. Today, the top 10 companies in the S&P 500 represent around 35% of the entire index. Given the concentration within the index, it is more difficult to use it as a proxy for the overall large-cap market.
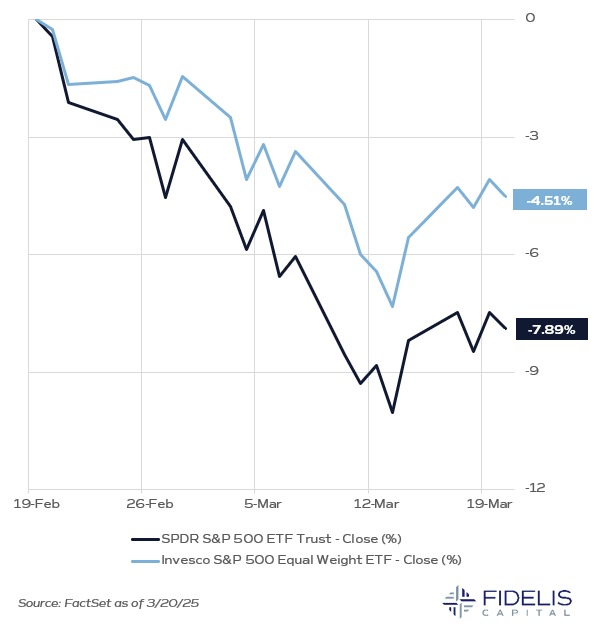
The first chart below shows the performance of SPY (S&P 500 ETF) versus RSP (S&P 500 Equal Weight ETF) since the all-time high on February 19. RSP assigns all 500 companies an equal weighting of 0.25%. Due to this change, returns on RSP represent the average performance of stocks in the S&P 500. As we can see from the chart, the average stock is down a much more manageable 4.51% from the highs.
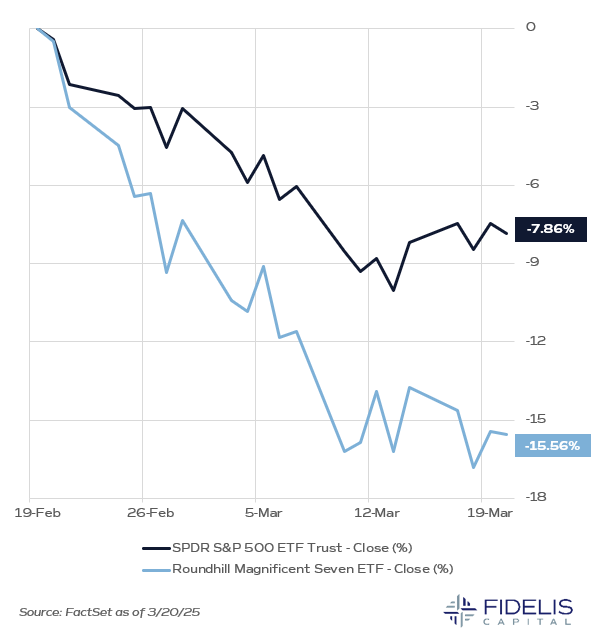
This leads us to the second chart, which shows the performance of SPY versus MAGS (Magnificent 7 ETF). As you might expect, we can see these larger technology companies have driven a significant amount of the current correction. Over the last two years, these companies were the primary drivers of returns, in effect leaving the average stock behind. Thus far in 2025, the opposite is true, and the average stock is actually contributing to performance.
This market behavior is why it is important for investors to manage their risk budgets appropriately and not over-concentrate in any specific names. It also shows that, although this correction has felt painful, the market may be holding together better than it appears at face value.
Takeaways from the Fed's March Meeting
The Fed’s March meeting resulted in a decision to leave rates unchanged, which was in line with market expectations. Markets were also anticipating the new Summary of Economic Projections (SEP), which includes the popular dot plot.While the headlines are focused on the dot plot, there is other information in the SEP that is more relevant. Three key changes in the latest SEP jumped out to us.
1. Slower Growth: There was a change in the median real GDP projections for 2025 by -0.4%, -0.2% for 2026 and -0.1% for 2027.
2. Slightly Weaker Jobs: The Fed increased its unemployment rate projections for 2025 to 4.4% from 4.3%.
3. Higher Inflation: The projections for inflation over the next three years were all revised higher, with the most notable being a 0.3% increase in Core PCE and a 0.2% increase in PCE for 2025.
These key shifts are not reflected in the dots. At best, this highlights how the dot plot implies a confusing message.
“The dot plot doesn’t have a good track record, its dispersion among FOMC members is not reflective of actual votes and it can contradict the message the FOMC is trying to send,” says Chris Gunster, Head of Fixed Income, in a recent Forbes.com column. (Read his full story linked here to learn about the dot plot and why it no longer serves its primary purpose: providing transparency.)
For a better understanding of the Fed’s potential next move, we recommend that investors ditch the dots and focus on more relevant SEP data, including the projected appropriate monetary policy table below (click here for the Fed’s PDF version).
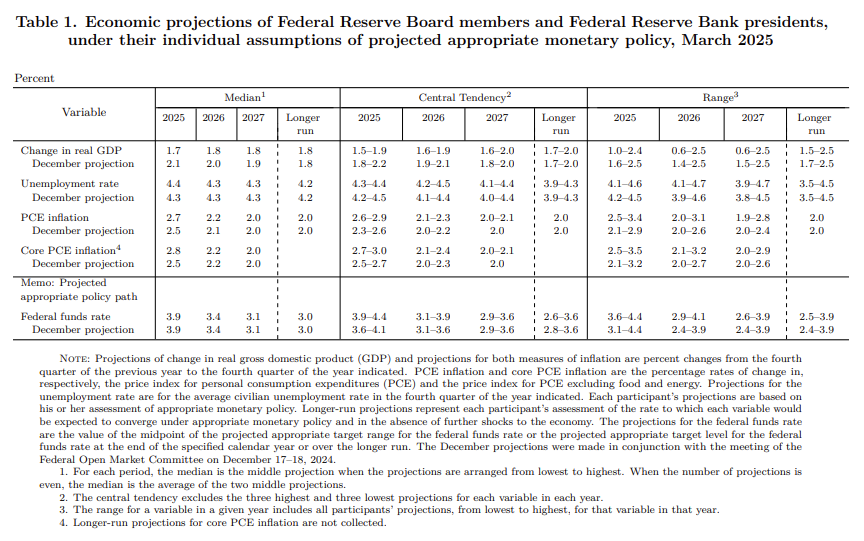
The three changes mentioned above from this table suggest that, at the margin, the probability of stagflation has increased. While not our base case, the odds are increasing, which will make the Fed’s job more difficult and investment decisions more challenging. Chris outlines key takeaways for investors in his latest Forbes.com column – click here to read.
Bonus
As Tax Day approaches, numerous clients have asked questions about reporting retirement accounts, especially regarding Forms 1099-R and 5498.What details should you provide to your tax preparer? How can you avoid costly mistakes?
Our CEO and Head of Wealth Planning, Rick Simonetti—who is also a former CPA—shares five essential questions to guide you through the process.
Read the full piece (linked here) to ensure you’re providing accurate information to your tax preparer.